Learn more about OHM-01
The "Assessing Overall Well-Being" fact sheet explores how data for OHM-01 were collected and highlights key findings.

OHM-01 measures overall well-being assessed via a question on life satisfaction and can help researchers and policymakers understand how individuals view their own lives and well-being. This information can inform strategies to increase the health and resilience of communities across the United States.
To learn how data for OHM-01 were collected, check out the "Assessing Overall Well-Being" fact sheet.

Most Recent Data:
96.0
percent
(2024) *

National Baseline:
95.2 percent of adults aged 18 years and over were satisfied or very satisfied with life in 2021 *
* Age adjusted to the year 2000 standard population.
View CI in the chart by hovering over a data point.
View SE in the chart by hovering over a data point.
Confidence Interval (CI) not available Standard Error (SE) not available Confidence Interval (CI) and Standard Error (SE) are not available
| Population | 2021 | 2022 | 2023 | 2024 |
|---|---|---|---|---|
Total |
95.2 CI 94.9 / 95.5 SE 0.156 |
95.9 CI 95.6 / 96.2 SE 0.153 |
95.8 CI 95.5 / 96.1 SE 0.156 |
96.0 CI 95.7 / 96.3 SE 0.145 |
| Population | 2021 | 2022 | 2023 | 2024 |
|---|---|---|---|---|
Male |
94.9 CI 94.5 / 95.3 SE 0.233 |
95.8 CI 95.3 / 96.2 SE 0.228 |
95.6 CI 95.1 / 95.9 SE 0.224 |
95.8 CI 95.4 / 96.2 SE 0.217 |
Female |
95.5 CI 95.1 / 95.9 SE 0.209 |
96.1 CI 95.7 / 96.4 SE 0.197 |
96.1 CI 95.7 / 96.4 SE 0.203 |
96.2 CI 95.9 / 96.6 SE 0.191 |
| Population | 2021 | 2022 | 2023 | 2024 |
|---|---|---|---|---|
American Indian or Alaska Native only2 |
94.5 CI 90.7 / 97.1 SE 1.217 |
95.0 CI 91.3 / 97.5 SE 1.500 |
94.6 CI 89.6 / 97.6 SE 1.882 |
91.4 CI 86.5 / 94.9 SE 1.997 |
Asian only |
96.8 CI 95.7 / 97.8 SE 0.521 |
97.9 CI 96.9 / 98.7 SE 0.424 |
97.9 CI 97.0 / 98.6 SE 0.367 |
97.2 CI 96.1 / 98.0 SE 0.469 |
Native Hawaiian or Other Pacific Islander only2 |
93.02 CI 80.7 / 98.6 SE 3.770 |
95.72 CI 88.8 / 99.0 SE 2.164 |
90.4 CI 77.1 / 97.4 SE 5.222 |
98.4 CI 93.8 / 99.9 SE 0.939 |
Black or African American only |
93.9 CI 92.9 / 94.8 SE 0.494 |
95.2 CI 94.3 / 96.1 SE 0.473 |
93.8 CI 92.7 / 94.8 SE 0.542 |
95.0 CI 94.1 / 95.9 SE 0.470 |
White only |
95.3 CI 95.0 / 95.6 SE 0.174 |
95.9 CI 95.6 / 96.3 SE 0.180 |
96.0 CI 95.6 / 96.3 SE 0.178 |
96.1 CI 95.8 / 96.4 SE 0.170 |
2 or more races |
92.2 CI 89.2 / 94.5 SE 1.325 |
92.8 CI 89.4 / 95.4 SE 1.492 |
93.4 CI 90.6 / 95.6 SE 1.236 |
92.0 CI 89.3 / 94.1 SE 1.200 |
Hispanic or Latino |
95.9 CI 95.1 / 96.6 SE 0.362 |
96.6 CI 95.9 / 97.3 SE 0.342 |
96.5 CI 95.8 / 97.1 SE 0.322 |
96.6 CI 96.0 / 97.2 SE 0.302 |
Not Hispanic or Latino |
95.1 CI 94.7 / 95.4 SE 0.176 |
95.7 CI 95.4 / 96.0 SE 0.177 |
95.6 CI 95.3 / 95.9 SE 0.179 |
95.9 CI 95.6 / 96.1 SE 0.165 |
American Indian or Alaska Native only, not Hispanic or Latino2 |
93.8 CI 89.1 / 96.8 SE 1.439 |
94.32 CI 89.1 / 97.5 SE 2.093 |
92.5 CI 84.3 / 97.3 SE 3.113 |
90.5 CI 85.2 / 94.4 SE 2.253 |
Asian only, not Hispanic or Latino |
96.8 CI 95.6 / 97.8 SE 0.526 |
98.0 CI 96.9 / 98.7 SE 0.426 |
97.9 CI 97.0 / 98.6 SE 0.371 |
97.2 CI 96.1 / 98.0 SE 0.473 |
Native Hawaiian or Other Pacific Islander only, not Hispanic or Latino2 |
96.22 CI 89.2 / 99.2 SE 1.856 |
95.52 CI 87.9 / 98.9 SE 2.319 |
91.6 CI 78.0 / 98.1 SE 5.097 |
99.4 CI 95.0 / 100.0 SE 0.562 |
Black or African American only, not Hispanic or Latino |
94.0 CI 92.9 / 94.9 SE 0.511 |
95.3 CI 94.3 / 96.1 SE 0.488 |
93.7 CI 92.6 / 94.7 SE 0.559 |
95.1 CI 94.1 / 95.9 SE 0.479 |
White only, not Hispanic or Latino |
95.2 CI 94.8 / 95.5 SE 0.193 |
95.7 CI 95.3 / 96.0 SE 0.203 |
95.8 CI 95.5 / 96.1 SE 0.201 |
96.1 CI 95.7 / 96.4 SE 0.190 |
2 or more races, not Hispanic or Latino |
92.7 CI 89.4 / 95.1 SE 1.399 |
92.2 CI 88.5 / 95.0 SE 1.662 |
92.6 CI 89.2 / 95.3 SE 1.502 |
91.4 CI 88.4 / 93.8 SE 1.347 |
| Population | 2021 | 2022 | 2023 | 2024 |
|---|---|---|---|---|
18-44 years |
95.6 CI 95.2 / 96.1 SE 0.235 |
96.4 CI 95.9 / 96.8 SE 0.229 |
95.9 CI 95.4 / 96.4 SE 0.245 |
96.5 CI 96.1 / 96.9 SE 0.208 |
18-24 years |
95.7 CI 94.5 / 96.7 SE 0.540 |
95.9 CI 94.7 / 96.9 SE 0.546 |
95.7 CI 94.4 / 96.7 SE 0.559 |
96.5 CI 95.4 / 97.4 SE 0.490 |
25-44 years |
95.6 CI 95.1 / 96.1 SE 0.254 |
96.6 CI 96.1 / 97.0 SE 0.236 |
96.0 CI 95.4 / 96.5 SE 0.261 |
96.5 CI 96.1 / 97.0 SE 0.226 |
45-64 years |
94.5 CI 94.0 / 95.0 SE 0.262 |
95.6 CI 95.0 / 96.0 SE 0.245 |
95.9 CI 95.4 / 96.3 SE 0.237 |
95.5 CI 95.0 / 96.0 SE 0.254 |
45-54 years |
94.7 CI 93.9 / 95.4 SE 0.379 |
95.7 CI 95.0 / 96.4 SE 0.365 |
96.4 CI 95.7 / 97.0 SE 0.326 |
95.7 CI 94.9 / 96.4 SE 0.371 |
55-64 years |
94.3 CI 93.6 / 95.0 SE 0.356 |
95.4 CI 94.7 / 96.0 SE 0.323 |
95.4 CI 94.7 / 96.1 SE 0.334 |
95.3 CI 94.6 / 95.9 SE 0.343 |
65 years and over |
95.2 CI 94.7 / 95.7 SE 0.262 |
95.1 CI 94.5 / 95.6 SE 0.267 |
95.3 CI 94.8 / 95.7 SE 0.244 |
95.4 CI 94.9 / 95.8 SE 0.245 |
65-74 years |
95.5 CI 94.7 / 96.1 SE 0.335 |
95.5 CI 94.8 / 96.2 SE 0.341 |
95.8 CI 95.2 / 96.4 SE 0.287 |
95.8 CI 95.1 / 96.3 SE 0.311 |
75-84 years |
95.4 CI 94.5 / 96.3 SE 0.430 |
94.6 CI 93.6 / 95.6 SE 0.502 |
95.1 CI 94.1 / 95.9 SE 0.466 |
95.3 CI 94.4 / 96.1 SE 0.418 |
85 years and over |
92.9 CI 90.7 / 94.7 SE 0.970 |
93.7 CI 91.6 / 95.4 SE 0.941 |
92.6 CI 90.2 / 94.5 SE 1.049 |
93.6 CI 91.4 / 95.4 SE 0.979 |
| Population | 2021 | 2022 | 2023 | 2024 |
|---|---|---|---|---|
Less than High school |
92.4 CI 91.0 / 93.7 SE 0.803 |
93.7 CI 92.6 / 94.8 SE 0.635 |
94.3 CI 93.2 / 95.3 SE 0.639 |
94.1 CI 92.9 / 95.1 SE 0.604 |
High school |
94.2 CI 93.6 / 94.9 SE 0.358 |
95.5 CI 94.9 / 96.0 SE 0.326 |
95.1 CI 94.5 / 95.7 SE 0.324 |
95.0 CI 94.4 / 95.6 SE 0.346 |
Some college or Associate degree |
94.2 CI 93.6 / 94.8 SE 0.326 |
95.0 CI 94.4 / 95.6 SE 0.318 |
94.6 CI 94.0 / 95.2 SE 0.340 |
95.6 CI 95.1 / 96.1 SE 0.290 |
4-year college degree or more |
97.0 CI 96.7 / 97.4 SE 0.180 |
97.5 CI 97.2 / 97.8 SE 0.170 |
97.8 CI 97.4 / 98.1 SE 0.167 |
97.4 CI 97.0 / 97.7 SE 0.172 |
| Population | 2021 | 2022 | 2023 | 2024 |
|---|---|---|---|---|
<100 |
89.6 CI 88.2 / 90.9 SE 0.710 |
92.0 CI 90.7 / 93.2 SE 0.646 |
91.6 CI 90.4 / 92.8 SE 0.650 |
90.7 CI 89.3 / 91.9 SE 0.680 |
100-199 |
93.1 CI 92.3 / 93.9 SE 0.436 |
93.3 CI 92.4 / 94.1 SE 0.467 |
93.5 CI 92.7 / 94.3 SE 0.437 |
94.2 CI 93.4 / 95.0 SE 0.431 |
200-399 |
95.2 CI 94.7 / 95.8 SE 0.300 |
95.9 CI 95.3 / 96.4 SE 0.301 |
95.9 CI 95.3 / 96.4 SE 0.311 |
96.2 CI 95.7 / 96.7 SE 0.266 |
400+ |
97.2 CI 96.9 / 97.6 SE 0.178 |
97.7 CI 97.4 / 98.1 SE 0.182 |
97.5 CI 97.1 / 97.9 SE 0.203 |
97.7 CI 97.4 / 98.0 SE 0.187 |
| Population | 2021 | 2022 | 2023 | 2024 |
|---|---|---|---|---|
Insured |
95.4 CI 95.0 / 95.7 SE 0.192 |
96.3 CI 95.9 / 96.6 SE 0.183 |
96.0 CI 95.7 / 96.4 SE 0.191 |
96.4 CI 96.0 / 96.7 SE 0.171 |
Private |
96.7 CI 96.3 / 97.0 SE 0.180 |
97.5 CI 97.1 / 97.8 SE 0.182 |
97.3 CI 97.0 / 97.6 SE 0.175 |
97.3 CI 96.9 / 97.6 SE 0.172 |
Public |
90.2 CI 89.1 / 91.3 SE 0.577 |
92.0 CI 91.0 / 93.0 SE 0.522 |
91.5 CI 90.4 / 92.6 SE 0.568 |
92.9 CI 91.9 / 93.8 SE 0.501 |
Uninsured |
94.2 CI 93.1 / 95.2 SE 0.514 |
94.9 CI 93.8 / 95.9 SE 0.521 |
95.0 CI 93.8 / 96.1 SE 0.562 |
94.7 CI 93.4 / 95.8 SE 0.588 |
| Population | 2021 | 2022 | 2023 | 2024 |
|---|---|---|---|---|
Metropolitan |
95.3 CI 95.0 / 95.6 SE 0.161 |
95.9 CI 95.6 / 96.2 SE 0.165 |
95.8 CI 95.5 / 96.1 SE 0.167 |
96.0 CI 95.7 / 96.3 SE 0.156 |
Non-metropolitan |
94.6 CI 93.7 / 95.4 SE 0.490 |
95.9 CI 95.1 / 96.5 SE 0.401 |
95.9 CI 95.0 / 96.6 SE 0.457 |
96.1 CI 95.4 / 96.8 SE 0.395 |
| Population | 2021 | 2022 | 2023 | 2024 |
|---|---|---|---|---|
Married/Cohabiting partner |
97.0 CI 96.7 / 97.3 SE 0.162 |
97.6 CI 97.3 / 97.8 SE 0.146 |
97.5 CI 97.2 / 97.8 SE 0.156 |
97.3 CI 97.0 / 97.6 SE 0.159 |
Divorced, separated, widowed |
90.7 CI 89.7 / 91.6 SE 0.817 |
92.9 CI 92.1 / 93.6 SE 0.699 |
92.2 CI 91.4 / 93.0 SE 0.720 |
93.2 CI 92.5 / 94.0 SE 0.660 |
Never married |
92.8 CI 92.1 / 93.5 SE 0.391 |
93.0 CI 92.2 / 93.8 SE 0.472 |
92.6 CI 91.8 / 93.4 SE 0.453 |
93.0 CI 92.2 / 93.8 SE 0.449 |
| Population | 2021 | 2022 | 2023 | 2024 |
|---|---|---|---|---|
US |
95.0 CI 94.7 / 95.3 SE 0.175 |
95.6 CI 95.3 / 95.9 SE 0.181 |
95.5 CI 95.1 / 95.8 SE 0.182 |
95.8 CI 95.5 / 96.1 SE 0.169 |
Outside US |
96.3 CI 95.6 / 96.9 SE 0.327 |
97.2 CI 96.5 / 97.7 SE 0.296 |
97.1 CI 96.5 / 97.7 SE 0.292 |
96.7 CI 96.1 / 97.3 SE 0.312 |
| Population | 2021 | 2022 | 2023 | 2024 |
|---|---|---|---|---|
Veteran |
93.4 CI 92.2 / 94.5 SE 0.869 |
94.5 CI 93.4 / 95.4 SE 0.724 |
94.5 CI 93.3 / 95.6 SE 0.865 |
96.0 CI 95.1 / 96.7 SE 0.506 |
Non-veteran |
95.3 CI 95.0 / 95.6 SE 0.163 |
95.9 CI 95.6 / 96.2 SE 0.163 |
95.8 CI 95.5 / 96.1 SE 0.161 |
96.0 CI 95.7 / 96.3 SE 0.152 |
| Population | 2021 | 2022 | 2023 | 2024 |
|---|---|---|---|---|
People with disabilities |
79.4 CI 77.5 / 81.1 SE 1.480 |
81.7 CI 80.0 / 83.3 SE 1.260 |
82.6 CI 81.0 / 84.1 SE 1.183 |
82.8 CI 81.2 / 84.3 SE 1.109 |
People without disabilities |
96.4 CI 96.2 / 96.7 SE 0.141 |
97.2 CI 96.9 / 97.4 SE 0.139 |
96.9 CI 96.7 / 97.2 SE 0.140 |
97.3 CI 97.0 / 97.5 SE 0.125 |
| Population | 2021 | 2022 | 2023 | 2024 |
|---|---|---|---|---|
Straight |
95.5 CI 95.2 / 95.8 SE 0.160 |
96.3 CI 96.0 / 96.6 SE 0.153 |
96.2 CI 95.9 / 96.4 SE 0.158 |
96.4 CI 96.1 / 96.7 SE 0.145 |
Straight, Male |
95.1 CI 94.7 / 95.6 SE 0.240 |
96.1 CI 95.6 / 96.5 SE 0.226 |
95.9 CI 95.5 / 96.3 SE 0.221 |
96.1 CI 95.6 / 96.5 SE 0.222 |
Straight, Female |
95.9 CI 95.5 / 96.3 SE 0.208 |
96.5 CI 96.1 / 96.9 SE 0.197 |
96.5 CI 96.1 / 96.8 SE 0.203 |
96.8 CI 96.4 / 97.1 SE 0.182 |
Gay/Lesbian |
92.9 CI 89.8 / 95.3 SE 1.354 |
94.6 CI 91.4 / 96.9 SE 1.340 |
93.8 CI 91.1 / 95.8 SE 1.137 |
95.0 CI 92.9 / 96.7 SE 0.918 |
Gay, Male |
93.1 CI 89.5 / 95.7 SE 1.490 |
93.4 CI 88.3 / 96.8 SE 2.025 |
94.1 CI 90.3 / 96.7 SE 1.509 |
93.6 CI 90.2 / 96.1 SE 1.408 |
Gay/Lesbian, Female |
92.82 CI 86.9 / 96.6 SE 2.369 |
96.42 CI 92.2 / 98.7 SE 1.429 |
93.1 CI 88.5 / 96.3 SE 1.874 |
96.4 CI 93.4 / 98.3 SE 1.102 |
Bisexual |
91.2 CI 88.2 / 93.6 SE 1.445 |
93.5 CI 90.2 / 95.9 SE 1.545 |
89.8 CI 85.9 / 93.0 SE 2.150 |
90.3 CI 87.7 / 92.5 SE 1.573 |
Bisexual, Male |
90.7 CI 84.0 / 95.3 SE 2.725 |
93.92 CI 88.6 / 97.2 SE 1.939 |
88.0 CI 78.8 / 94.2 SE 4.116 |
87.1 CI 80.2 / 92.3 SE 3.219 |
Bisexual, Female |
91.3 CI 87.8 / 94.0 SE 1.706 |
93.0 CI 89.1 / 95.9 SE 2.002 |
90.0 CI 85.4 / 93.5 SE 2.650 |
91.6 CI 88.9 / 93.9 SE 1.976 |
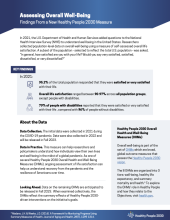
The "Assessing Overall Well-Being" fact sheet explores how data for OHM-01 were collected and highlights key findings.
Linking to a non-federal website does not constitute an endorsement by ODPHP or any of its employees of the sponsors or the information and products presented on the website.
You will be subject to the destination website's privacy policy when you follow the link.
HHS is not responsible for Section 508 compliance (accessibility) on other federal or private websites.